Start with a ticker, describe the universe you want to cover, or bring your own company list. Review the proposed peer groups, then turn them into a configurable, presentation-ready trading comps table in seconds
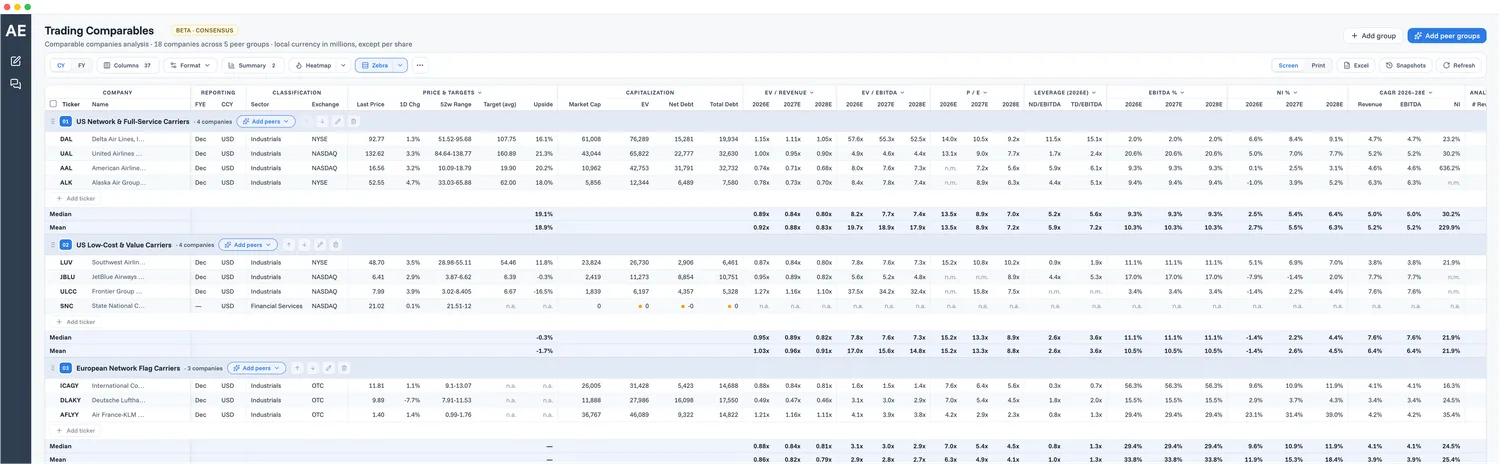
From building the right universe to a presentation-ready table
High-Quality Comp Universes, Under Your Control
Start from a ticker, a description of a market or theme, or a blank sheet and ask for candidates. Suggestions are grounded in company filings, industry reports, and news flow rather than generic "similar companies" lists, and candidates come with a clear rationale for inclusion that you review before adding. You always keep full manual control: type tickers with instant lookup, paste an entire list at once, and add or remove companies at any time
Multiple Peer Groups in One Table
Organize companies into clearly formatted peer groups within a single table, using color schemes and other formatting tools. Reorder groups and companies with drag and drop or sort, and exclude individual companies from statistics without removing them from the analysis
Comprehensive Multiples & Metrics
EV/Revenue, EV/EBITDA, and P/E across three estimate periods, plus forward growth, margins, leverage, capitalization, trading data, consensus price-target upside, and analyst coverage
Calendarized or Fiscal Basis
Switch between calendar-year and fiscal-year views with one click. Calendar mode blends fiscal estimates to align companies with different year ends; fiscal mode shows each company's next three fiscal years
Summary Statistics
High, quartiles, median, mean, and low per peer group, plus a grand summary across the whole set, computed over all companies or across your peer groups
Flexible Weighting & Custom Blends
Go beyond simple averages: assign your own weights to peer groups and blend them into custom composite multiples. Include or exclude names with one click, rebalance instantly, and build segment breakdowns, for example weighting peer groups to mirror a diversified company's business mix
Historical Multiples
See how multiples have evolved over time. Compare where a company trades today against its own history, so you can instantly tell whether it looks cheap or expensive versus past trading ranges
Heatmaps & Distributions
Turn on heatmap coloring to see where each company sits within its group or in the whole set, and use distribution charts to understand how multiples spread across the set
Fully Configurable Layout & Formatting
Use column presets or build your own view: show or hide metrics, reorder and resize columns, set decimal precision. Apply row highlights, custom labels, peer-group colors, zebra bands, and column emphasis so the valuation story reads clearly on screen and in print
Data Transparency
Every figure comes from relevant, trusted data sources and is computed deterministically, in seconds, so each output traces directly back to the underlying data. The table shows its data-as-of date, flags stale balance-sheet figures, and surfaces missing, not-meaningful, or refresh-needed data instead of ignoring it
One-Click Refresh & Export
Your comp set is a living template: the layout saves automatically, and one click refreshes every price, estimate, and multiple to the latest data. It's then immediately ready to drop into a presentation or export as a styled Excel workbook
Point-in-Time Snapshots
Freeze your comp set at any moment. A snapshot captures every multiple and input exactly as they stood on that date and time, and stays in the system permanently until you delete it, so you can always cite the multiples behind a past analysis. Meanwhile the module itself stays live: you can keep updating and refreshing your comp set without ever affecting an existing snapshot
Describe Your Universe
Start from a ticker, describe the market or theme you want to cover, or create an empty group and add your own tickers. Combine all three approaches in the same comp set
The Agent Proposes the Comp Set
The agent reasons about each company's business, size, and segments to propose genuinely comparable peer groups, each with a short rationale, not the static sector irrelevant lists other tools usually return
You Review & Approve
Remove candidates, rename or reorganize groups, move companies between them, and add anything the agent missed. You decide what enters the table
Multiples Are Computed Instantly
AdvEngine loads all relevant data, then computes the multiples, margins, growth rates, and summary statistics deterministically
Shape the View
Pick columns and decimals, sort, apply heatmaps and highlights, set peer-group weights, and arrange everything until the table tells the story you want
Export, Snapshot & Revisit
Export a styled Excel workbook or use the clean print view, save immutable point-in-time snapshots, and return any time: your layout saves automatically and the pinned market data refreshes on demand
Investment Banking / Corporate Development
- Produce polished, presentation-ready comps pages for pitch decks, transaction, and fairness materials in a fraction of the time
- Maintain reusable sector comps that refresh on demand instead of rebuilding spreadsheets before every meeting
- Benchmark clients and targets against thematically organized peer groups, with defensible peer selection you can explain
- Build complex tables with weighted peer groups to get the right multiples in complex situations
Investment Funds
- Frame relative valuation for new ideas in seconds: see where a company trades against direct competitors, adjacent players, and benchmarks
- Compare valuation levels across sectors and watchlists, and spot dislocations between peer groups
- Sanity-check entry and exit multiples for existing positions against a consistently dated, refreshable peer set
- Snapshot comp sets at decision points to document the valuation context behind investment decisions
- Handle trickier names with weighted peer groups, so the multiples you rely on are the right ones
Continuous innovation to make Trading Comps even more useful
Single-Currency Comparison
View absolute figures like market capitalization and enterprise value converted into a single currency across the whole comp set, making cross-border peer groups even easier to read
Forward-Looking Historical Multiples
Track how companies' forward multiples evolved using the estimates available at each point in time. Backward-looking historical multiples are already available
Integration with Financial Modeling Agent
Feed comps directly into your financial models for relative valuation and football-field charts
Excel Add-in
Direct integration with Excel for a seamless workflow
More Metrics & Sector-Specific Multiples
Additional columns and specialized multiples for sectors where standard metrics don't tell the full story
Additional Source-Level Transparency
As of today, the data comes from data providers. We are working on going deeper: you will see source-level data, with every metric traced to company filings or specific data points from exchanges, including bond data, every calculation such as enterprise value laid out in full, and the ability to tweak manually what goes into each multiple. For consensus, you will see exactly which analyst reports are included, spot the outliers, and hand-pick the reports that go in
Find The Answers You Need
Quick answers to the questions that come up most